I’ve been working with Shiny Apps for a while, primarily using them to develop basketball analytics tools (example here). Recently, I started building a new version (live app) to improve structural issues I encountered.
This seemed like the perfect time to write a brief guide on structuring a Shiny app.
Organizing a Shiny App
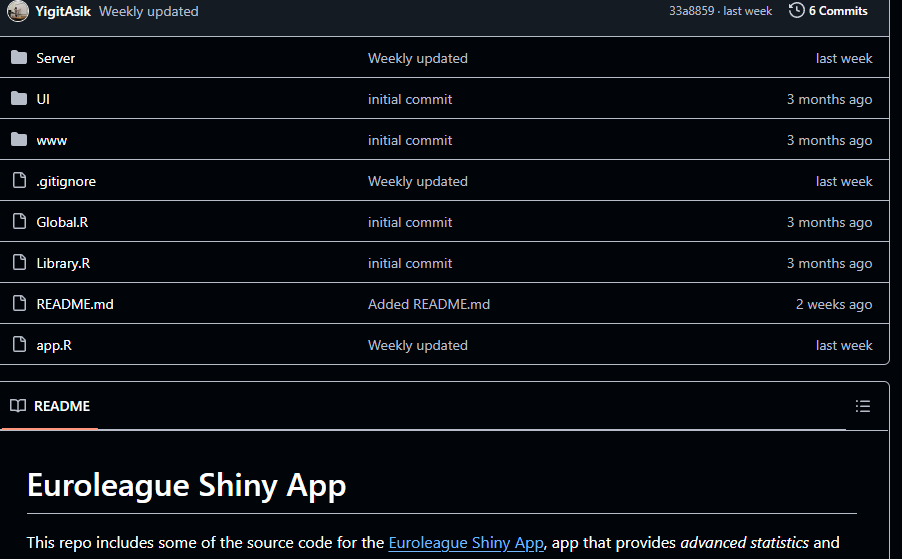
I structure my Shiny app using three key R files:
- Library.R – Loads dependencies
- Global.R – Contains utility functions
- app.R – Runs the application
In app.R, I first load dependencies (source('Library.R')), followed by app-specific functions (source('Global.R')).
The UI definition comes next. Instead of keeping all UI code in a single file, I store different panels inside a dedicated UI/ folder. This makes it easier to manage each component separately.
At the bottom of app.R, before calling shinyApp, I include the server logic, which is housed in the Server/ folder.
The Server Structure
The Server/ folder contains two separate files:
- reactiveData.R – Handles data loading and preprocessing
- data.R – Manages rendering and user interactions
reactiveData.R
This file is responsible for loading and preprocessing data, including:
- Converting column data types
- Sorting data frames for better readability
- Preparing datasets for interactive features
data.R
This file renders outputs and handles user interactions.
Rendering Tables
For dataframes, I use datatable with filtering enabled, allowing users to focus on specific sections of the data.
Handling User Inputs
When user interaction is required, such as submitting a request, I provide an action button (e.g., “Submit”) and monitor it using observeEvent.
The workflow:
1. The user clicks the button
2. The app captures the input
3. Necessary calculations are performed
4. The output is dynamically rendered
This logic can become complex depending on:
- The type of input (numeric vs. categorical)
- The complexity of calculations
- The number of panels and inputs
For a real-world example, check out the data.R file from my old Euroleague App, which contained different plotting options and expected different inputs.
I’m hoping to finish both of my apps this month. If you’re interested, keep an eye on my LinkedIn. Have a nice weekend!